

Soiling, the deposit of dust and particles on the modules, is one of the quietest losses and, in many assets, one of the most expensive. It triggers no alarm, grows gradually, and disappears in the monthly aggregate. Yet, compounded over the year, it drains whole percentage points of generation.
The loss that triggers no alarm
Unlike an inverter fault or a tracker outage, soiling has no single event. It is a rising curve: each day without rain or cleaning adds a fraction of loss. That is why most operations only notice the problem after it has already become expensive.
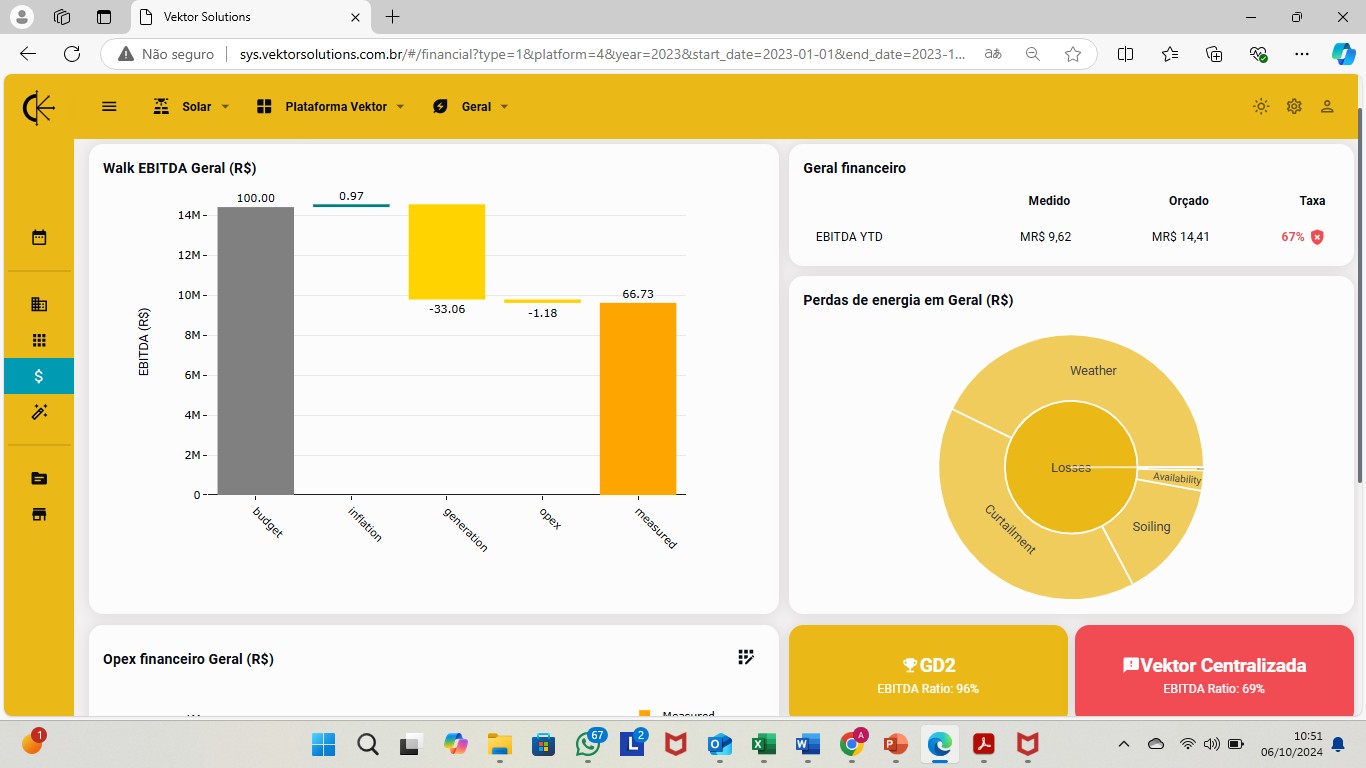
WEKTOR models the expected generation of each plant block and compares it with actual generation. Losses associated with soiling are analyzed alongside factors such as weather, curtailment, and availability and translated into financial impact.
The right question isn’t “is it dirty?”. It’s “how much is the dirt costing today, and when does it pay to clean?”.
From loss cost to the optimal cleaning point
With the loss in R$ on one side and the cleaning cost on the other, the optimal point stops being a field intuition and becomes a financial decision. The platform crosses both curves and recommends the window in which cleaning maximizes return.
- Soiling curve per block, not just plant average
- Accumulated loss converted into R$ and EBITDA
- Recommendation of the optimal cleaning window
The result is direct: fewer cleanings at the wrong time, more captured generation and an EBITDA that reflects the right decision — not the calendar.
See your asset’s soiling in R$.
Discover the WEKTOR Trial: three months at no cost, with expert guidance and a presentation of the results.
Keep reading
How to compare renewable asset performance
Coming soon
Curtailment isn’t destiny: reading grid loss in R$
Coming soon